


| Back to Tools By: Carter Chamberlain |
DESCRIPTION:
The following Java applet is an interactive plot showing the abundances of each stage of ionization of an element (e.g. HI and HII), plotted against the ionization parameter (both U and ξ).
CONTROLS:
Click and drag the mouse to choose the ionization parameter from the horizontal axis, which is displayed on that axis. The percent ionization of each ion will be displayed on the vertical axis, along with its name. At the top, To the left and right of the vertical ionization parameter line, are the names of the ions which peak to the left and right of the current ionization parameter (e.g. if CII and CIII are displayed, then the current ionization parameter is between the ionization peaks of CII and CIII).
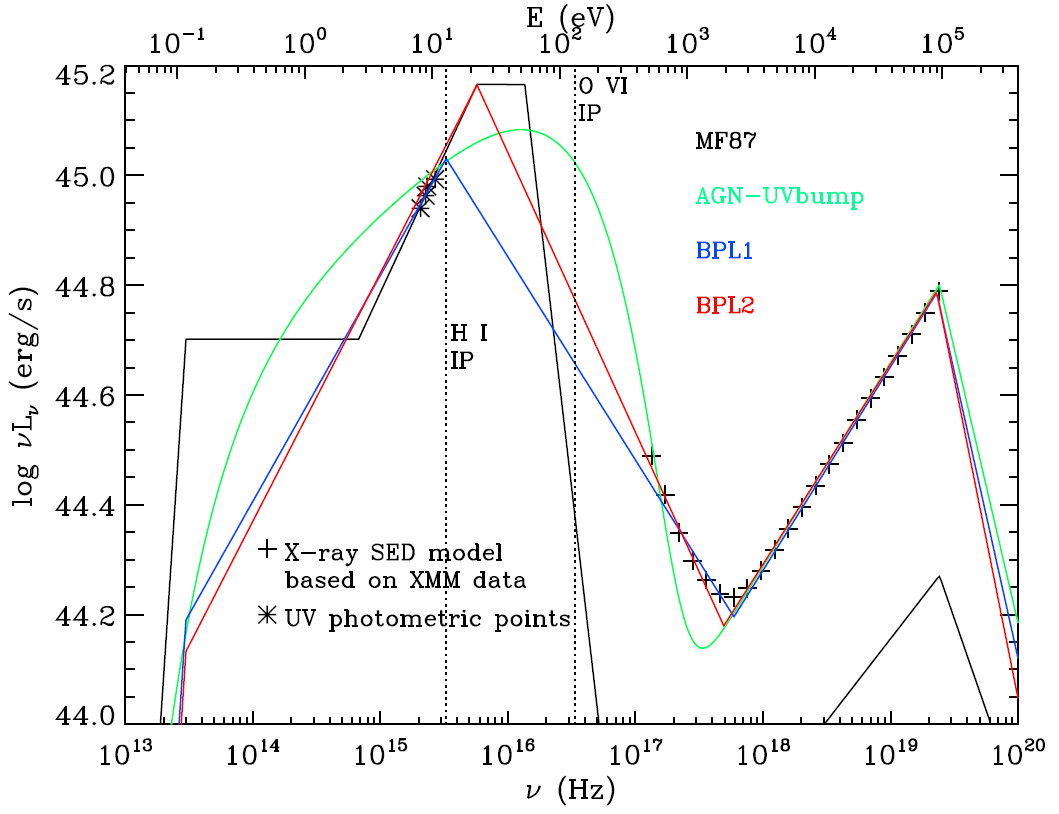
To change the SED (Spectral Energy Distribution), select the desired SED from the menu titled "SED". The SEDs available are described in Edmonds et al. and are shown below:
To choose a different element, select it from the menu entitled "Element".
Note: You can only display up to four elements.
As you sweep across the ionization parameters, the displayed data is available in a menu titled "Data", where it can be copied and pasted into another program or database.
You can set the vertical axis to either linear or log scale, as well as display the labels on the plot for each ion, from the "View" menu.
DISPLAY NOTES:
If multiple SEDs are displayed, the ionization parameter ξ corresponds to the first selected SED in the menu.
COPYRIGHT:
This page and program was created by Carter Chamberlain for the Quasar Outflow group, led by Dr. Nahum Arav, at Virginia Tech.
Project codename: IoFracREFERENCES:
Mathews, W. G., & Ferland, G. J. 1987, ApJ, 323, 456
Edmonds, D. et al. 2011, accepted to ApJ
